
The AI Wealth Gap: Why the Stock Boom is Making America More Unequal
Nvidia's 295% surge and the AI stock boom have created $10 trillion in new wealth—but 50% of it went to the wealthiest 1% who own half of all stocks. With the bottom 50% owning just 1% of equity markets, the AI revolution is widening America's wealth gap to Gilded Age levels. As Fortune 500 companies pour $380 billion into AI infrastructure and the 'Magnificent Seven' control 36.6% of the S&P 500, the question isn't whether AI will transform the economy—it's whether its benefits will be shared or concentrated among those who already have the most.
The AI Wealth Gap: Why the Stock Boom is Making America More Unequal
The artificial intelligence revolution has created one of the most spectacular stock market booms in modern history. Nvidia's stock has surged nearly 300% since January 2024, while the "Magnificent Seven" tech giants have added over $10 trillion in market capitalization.[1][2] Yet this wealth creation has a dark side: it's making America dramatically more unequal.
With the wealthiest 1% of Americans owning half of all stocks and the bottom 50% holding just 1%, the AI boom is widening the chasm between the haves and have-nots to levels not seen since the Gilded Age.[3][4] This comprehensive analysis examines how the AI stock surge is reshaping American inequality across multiple dimensions—from stock ownership patterns and retirement security to demographic disparities and future policy implications.
The AI stock boom is creating unprecedented wealth—but it's flowing overwhelmingly to those who already own the most assets
The Stark Reality of Stock Ownership in America
When Nvidia's stock price soared 171% in 2024, or when the S&P 500 gained 25% that same year, headlines celebrated the wealth creation.[5] But a critical question often goes unasked: who actually benefits from these gains?
The answer is stark and sobering. As of the second quarter of 2025, the wealthiest 1% of American households owned $25.6 trillion in corporate stock and mutual fund shares—representing 50% of all such holdings in the United States.[6] Meanwhile, the bottom 50% of households collectively held just $540 billion, or a mere 1% of total stock wealth.
"The top 20% wealthiest U.S. households own nearly 93% of all stock," explains Edward Nathan Wolff, an economics professor at New York University. "This means that as the stock market rises, it really widens the wealth and income gap."[7]
The Demographics of Stock Ownership
The concentration becomes even more pronounced when examining demographic breakdowns:
By Income Level:
- 87% of households earning $100,000+ own stock[8]
- Only 28% of households earning under $50,000 own stock
- Among the poorest 20% of households, just 5% own $10,000 or more in stocks
By Race and Ethnicity (2025 data):
- 70% of White adults own stock[9]
- 53% of Black adults own stock
- 38% of Hispanic adults own stock
The disparities extend beyond ownership rates to the value of holdings. In 2022, the median value of stock holdings was:
- White families: $67,800[10]
- Hispanic families: $24,500
- Black families: $16,500
By Age:
- Baby Boomers hold 54% of all equities, valued at $27.5 trillion[11]
- Gen X owns 22% ($11.2 trillion)
- Millennials own just 9% ($4.4 trillion)
While 62% of American adults own stock in some form as of 2025, the nature of that ownership matters enormously.[12] Most Americans hold stocks indirectly through retirement accounts like 401(k)s and IRAs, with relatively modest balances. Only 21% of American families directly own individual shares.
 Wall Street's AI boom is creating fortunes—but only for those with significant stock portfolios
The AI Stock Performance Phenomenon
The numbers are staggering. From January 2024 through November 2025, AI-related stocks have delivered returns that dwarf broader market performance:
Cumulative Returns (Jan 2024 - Nov 2025):
- Nvidia (NVDA): +295%[13]
- Alphabet/Google (GOOGL): +101%
- Meta Platforms (META): +77%
- Amazon (AMZN): +57%
- S&P 500 (SPY): +45%
- Microsoft (MSFT): +39%
Nvidia alone contributed over 22% of the S&P 500's total return in 2024, despite representing a much smaller portion of the index.[14] The company's market capitalization briefly surpassed $4 trillion in 2025, making it the world's most valuable company.
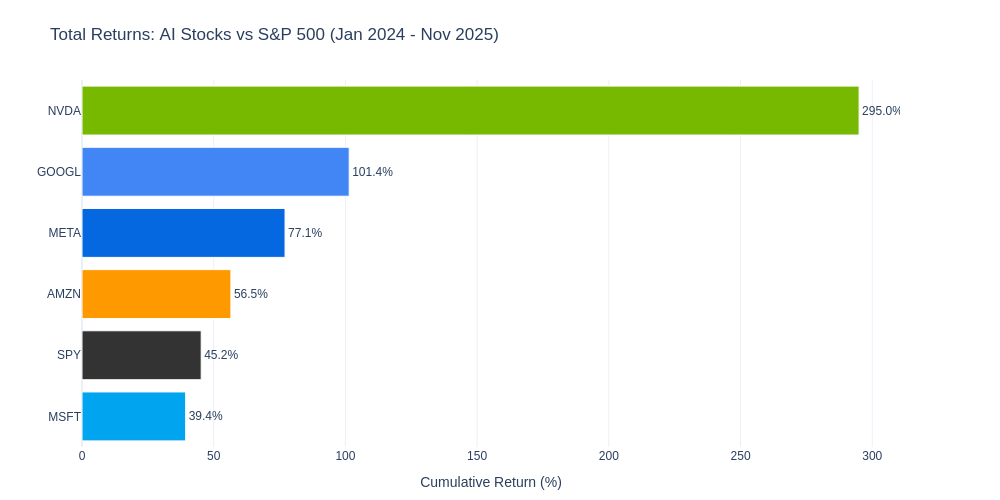 AI stocks massively outperformed the broader market, with Nvidia leading at +295% while the S&P 500 gained 45%
The "Magnificent Seven" Domination
The concentration of AI-driven gains in a handful of companies is unprecedented. The "Magnificent Seven"—Nvidia, Microsoft, Apple, Alphabet, Amazon, Meta, and Tesla—now comprise 36.6% of the S&P 500's total market capitalization, up from just 12.3% in 2015.[15]
According to Michael Cembalest, chairman of market and investment strategy for J.P. Morgan Asset Management, stocks tied to AI accounted for approximately 75% of S&P 500 returns since ChatGPT's launch in November 2022.[16]
In 2024 alone:
- The Magnificent Seven collectively gained 63%[17]
- They accounted for roughly 75% of the S&P 500's earnings growth
- Technology and communication services sectors combined were responsible for 56.5% of the index's total return
The AI Infrastructure Spending Surge
What's driving these astronomical returns? Massive capital expenditures on AI infrastructure. The five largest tech companies are collectively expected to spend over $380 billion on AI infrastructure and data centers in 2025:[18][19]
- Amazon: $125 billion (up from $118 billion forecast)
- Microsoft: ~$94 billion minimum (up from $64.55 billion in FY2025)
- Alphabet/Google: $91-93 billion (up from $75-85 billion forecast)
- Meta: $70-72 billion
- Apple: Significant but undisclosed amounts
 The AI boom has created one of the strongest bull markets in history—but its benefits are narrowly concentrated
Wealth Concentration: The Numbers Behind the Inequality
The AI stock boom has turbocharged an already troubling trend in wealth concentration. Federal Reserve data reveals the extent of the divide:
Wealth Distribution in Q2 2025:
- Top 1%: Hold 31.0% of total household net worth[20]
- Top 10%: Hold 67.8% of total household net worth
- Bottom 50%: Hold just 2.3% of total household net worth
When it comes specifically to stock ownership:
- Top 1%: Own 50% of all stocks ($25.6 trillion)[21]
- Top 10%: Own 87% of all stocks ($57.9 trillion)
- Bottom 50%: Own 1% of all stocks ($540 billion)
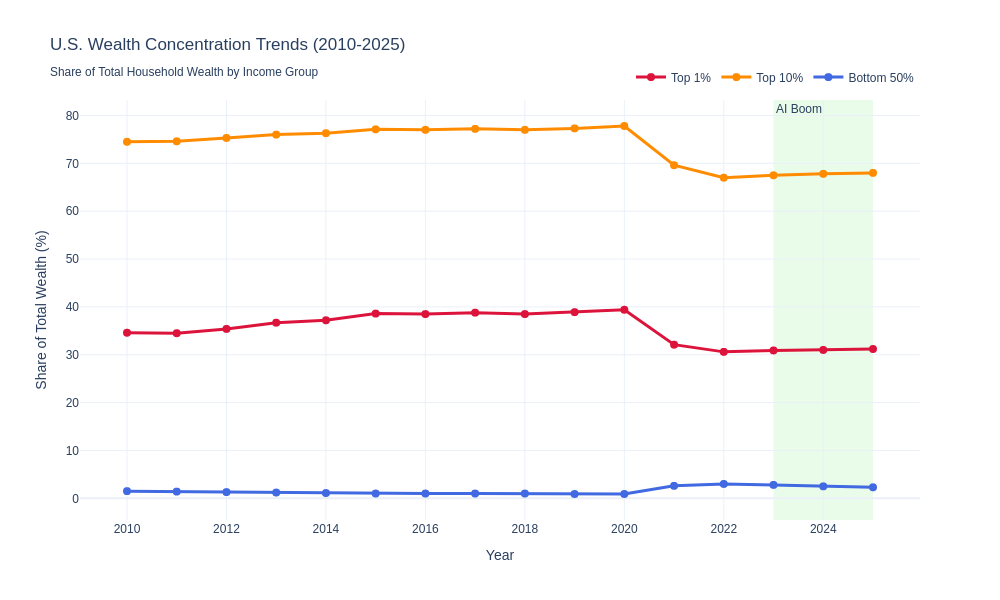 Wealth concentration has accelerated dramatically during the AI boom, with the top 1% owning an increasing share while the bottom 50% stagnates
The AI Boom's Disproportionate Impact
The $8 trillion increase in publicly traded stock wealth over the past year has flowed overwhelmingly to those who already held substantial portfolios.[22] With AI-related stocks accounting for 75% of market gains, and the wealthiest 1% owning half of all stocks, simple mathematics reveals the problem: the AI boom is essentially a wealth transfer mechanism to the already-wealthy.
"As the stock market rises, it really widens the wealth and income gap," emphasizes Professor Wolff. "This is a significant part of the inequality story."[23]
Historical Context: Worse Than the Gilded Age
The current level of wealth concentration rivals—and in some measures exceeds—the inequality of the Gilded Age. Between 1979 and 2021, the average income of the wealthiest 0.01% of households grew nearly 27 times faster than that of the bottom 20% of earners.[24]
By 2021, the richest 1% of U.S. households averaged 139 times more income than the bottom 20%.[25] This represents a return to inequality levels not seen since before the progressive reforms of the early 20th century.
Economic Inequality Metrics: Measuring the Divide
The Gini coefficient, which measures income inequality on a scale from 0 (perfect equality) to 1 (perfect inequality), tells a troubling story about American inequality:
U.S. Gini Coefficient for Income (Recent Years):
- 2019: 0.419[26]
- 2020: 0.488
- 2021: 0.494 (peak)
- 2022: 0.488
- 2023: 0.485
- 2024: 0.488
The U.S. Gini coefficient places America among the most unequal developed nations. For comparison:
- Slovakia: 0.234[27]
- Germany: 0.324
- Canada: 0.317
- United States: 0.488
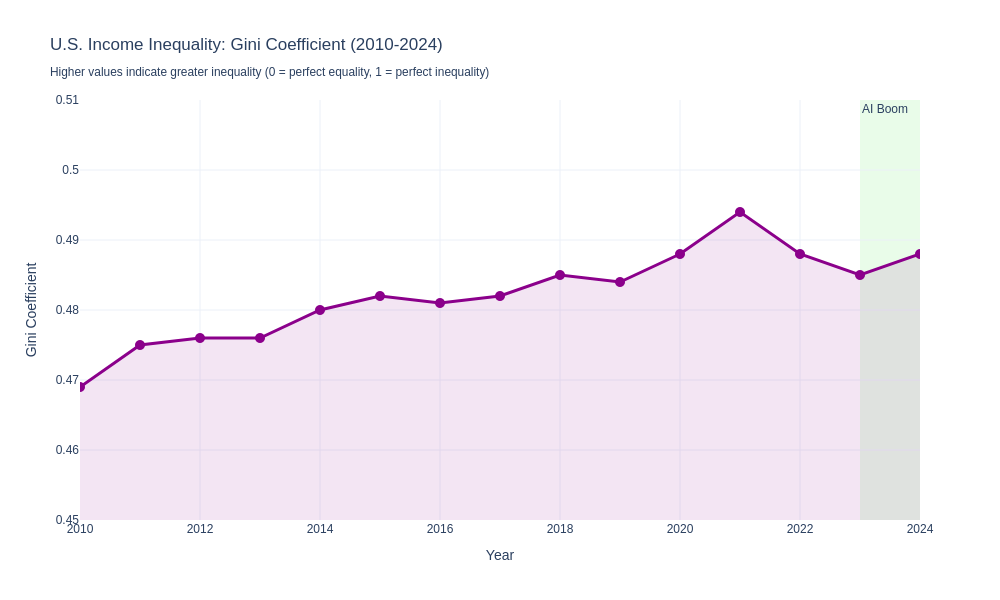 The U.S. Gini coefficient has remained stubbornly high, placing America among the most unequal developed nations
Wealth Inequality: Even More Extreme
While income inequality is severe, wealth inequality is even more pronounced. The Gini coefficient for wealth inequality in the United States stood at 0.74 in 2024, according to the UBS Global Wealth Report 2025.[28]
This places the U.S. among the world's most unequal countries in terms of wealth distribution, behind only:
- Brazil: 0.82
- Russia: 0.82
- South Africa: 0.81
- United Arab Emirates: 0.81
Capital Gains vs. Wage Income
A key driver of inequality is the preferential tax treatment of investment income. The ultra-rich derive a larger share of their income from investment profits, which are taxed at lower rates:[29]
- Long-term capital gains: Maximum 20% federal rate (plus 3.8% NIIT for high earners)
- Ordinary income: Up to 37% federal rate
This tax structure means that:
- 35% of White Americans' individual financial wealth is invested in stocks and mutual funds[30]
- 8% for Black Americans
- 14% for Hispanic Americans
The wealthy not only own more stocks but also benefit from more favorable tax treatment on their gains, creating a compounding advantage.
Wage Stagnation vs. Productivity Growth
While investment income has surged, wages have stagnated. From 1979 to 2024:[31]
- Worker productivity increased: 80.9%
- Average hourly compensation (inflation-adjusted) increased: 29.4%
This 51.5 percentage point gap represents wealth that flowed to capital owners rather than workers—a trend the AI boom is accelerating.
CEO Pay and Corporate Inequality
Corporate pay structures exemplify the growing divide. In 2021:[32]
- Average S&P 500 CEO pay: $18.3 million
- Average U.S. worker pay: $58,260
- CEO-to-worker pay ratio: 324:1
Stock-based compensation, which has surged with AI-driven market gains, is a primary driver of CEO pay increases.
 For most Americans, retirement accounts provide only modest exposure to the AI boom—with median 401(k) balances around $52,000
Retirement Security and the Racial Wealth Gap
Retirement Accounts: A Modest Buffer
While 60% of adults had a tax-preferred retirement account in 2023, these provide only limited protection against growing inequality.[33] As of mid-2024:
- Total U.S. retirement assets: $40 trillion[34]
- 401(k) plans specifically: $8 trillion
- Equity funds in 401(k)s: $3.1 trillion
- Median 401(k) balance: $52,000[35]
The median balance of $52,000 means that even strong market performance provides modest absolute gains for most Americans. A 25% market increase on $52,000 yields $13,000—meaningful, but nowhere near the millions or billions gained by the ultra-wealthy.
The Racial Wealth Gap
The AI stock boom is exacerbating America's persistent racial wealth gap. Stock ownership rates and values differ dramatically by race:
Stock Ownership Rates (2025):
- White adults: 70%[36]
- Black adults: 53%
- Hispanic adults: 38%
Median Stock Holdings (2022):
- White families: $67,800[37]
- Hispanic families: $24,500
- Black families: $16,500
Several factors contribute to lower stock market participation among minority households:[38]
1. Income Inequality: Lower average incomes mean less discretionary money for investment.
2. Unemployment Risk: Black workers face higher unemployment risk, especially during economic downturns, and are more likely to experience long-term unemployment. This risk encourages a more conservative approach to investing.
3. Historical Exclusion: Decades of discriminatory policies in housing, employment, and finance have limited wealth accumulation opportunities for Black and Hispanic families.
4. Financial Access: Minority households have historically had less access to financial advisors, investment education, and banking services.
Expert Analysis: What Economists Say
Economists across the political spectrum largely agree that the AI stock boom is exacerbating wealth and income inequality, though they differ on solutions.
Edward Nathan Wolff, NYU Economics Professor: "The top 20% wealthiest U.S. households own nearly 93% of all stock. As the stock market rises, it really widens the wealth and income gap. This is a significant part of the inequality story."[39]
Mark Zandi, Chief Economist at Moody's: "A widening wealth gap could lead to more political fracturing and make it harder to achieve consensus. It also creates a bifurcation in spending, making the U.S. economy more reliant on the spending of the wealthy, which could be vulnerable if that group faces economic challenges."[40]
Joseph Stiglitz, Nobel Prize-Winning Economist: Stiglitz warns that unregulated AI will worsen inequality, arguing that more jobs will be lost than created. "If macroeconomic policies are correctly implemented to maintain full employment and active labor-market policies are in place for retraining, societies might choose to work shorter weeks and prioritize well-being over measured GDP. However, I'm pessimistic about the political will to implement such policies."[41]
McKinsey Global Institute: Estimates that up to 375 million workers globally might need to change occupations by 2030 due to automation.[42] This displacement disproportionately impacts less-educated workers, increasing income disparity.
Gabriel Zucman and Thomas Piketty, Inequality Researchers: Emphasize that the rapid development of AI represents a shift in advantage from labor to capital, weakening labor institutions and potentially reducing tax bases. They advocate for progressive taxation policies to address capital accumulation within the technology industry.[43]
Policy Discussions: Addressing the AI Wealth Gap
Policymakers, economists, and advocates have proposed various interventions to address the wealth inequality exacerbated by the AI stock boom:
Capital Gains Tax Reform
Biden-Harris Administration Proposals:[44]
Increased Capital Gains Rates:
- Raise long-term capital gains tax from 20% to 28% for those earning $1 million+
- Combined with NIIT, this would create an all-in rate of 33%
- Rationale: Reduce the preferential treatment of investment income vs. wages
Billionaire Minimum Income Tax:
- 25% minimum tax on total income (including unrealized gains) for households with $100+ million in wealth
- Would end the "stepped-up basis" loophole for wealthy households
- Estimated to affect only ~10,000 households but raise significant revenue
Universal Investment Accounts
Proposals for Broader Stock Ownership:[45]
Baby Bonds:
- Government-funded investment accounts for all children at birth
- Accounts grow over time, accessible at adulthood
- Could provide capital for education, homeownership, or entrepreneurship
- Addresses intergenerational wealth gaps
Automatic 401(k) Enrollment:
- Require employers to auto-enroll workers in retirement plans
- Default contribution rates with opt-out option
- Expands stock market participation
- SECURE Act 2.0 includes some provisions[46]
Sovereign Wealth Fund:
- Alaska's Permanent Fund model: state-owned investments paying dividends to residents
- Could invest in AI companies and distribute returns broadly
- Ensures all citizens benefit from AI boom
Labor Market Interventions
Addressing Job Displacement:[47]
Retraining Programs:
- Federal funding for AI and technology skills training
- Community college partnerships with tech companies
- Apprenticeship programs in AI-adjacent fields
- Lifetime learning accounts
Unemployment Insurance Reform:
- Extended benefits for those displaced by automation
- Wage insurance to cushion income loss during transitions
- Portable benefits not tied to specific employers
Despite numerous proposals, political gridlock has prevented major reforms. Key obstacles include:
- Lobbying by tech companies and wealthy individuals
- Ideological divisions over taxation and redistribution
- Complexity of implementing wealth taxes
- Concerns about capital flight and economic competitiveness
Future Projections: The Long-Term Trajectory
The AI market is projected to continue explosive growth:
Global AI Market Size:[48]
- 2024: $235 billion
- 2028: $631 billion (projected)
- Compound annual growth rate: ~28%
This growth suggests continued strong performance for AI stocks, which means continued wealth concentration absent policy interventions.
Wealth Inequality Projections
If Current Trends Continue:[49]
By 2050 (World Inequality Database projections):
- Global top 1% income share: Could rise from 20% to over 24%
- Global bottom 50% share: Could fall to less than 9%
- Within the United States: Top 1% wealth share could increase from 31% to 35%+
- Bottom 50% wealth share: Could fall below 2%
AI-Specific Projections:
- Generative AI could widen the racial wealth gap by $43 billion annually over the next 20 years[50]
- Income gap between top and bottom earners could increase by $33 billion annually over the next decade
- Over 50% of AI gains projected to accrue to the upper income quintile
- Less than 5% to the bottom quintile
The Concentration Risk
The extreme concentration in AI stocks creates systemic risks:
- S&P 500 performance increasingly dependent on a handful of companies
- If AI stocks correct, broader market impact would be severe
- Retirement accounts heavily exposed to concentration risk
- Potential for rapid wealth destruction if bubble bursts
The dot-com crash saw the Nasdaq fall 78% from peak to trough (2000-2002).[51] A similar correction in AI stocks would:
- Wipe out trillions in wealth
- Disproportionately impact the wealthy (who own most stocks)
- But also devastate retirement accounts
- Potentially trigger broader economic crisis
Conclusion: The Crossroads of Innovation and Inequality
The AI stock boom represents one of the most significant wealth creation events in modern history. Nvidia's near-300% gain, the Magnificent Seven's $10 trillion in added market value, and the S&P 500's 25% surge in 2024 are testament to AI's transformative potential.
Yet this wealth creation has a profound dark side. With the top 1% owning half of all stocks and the bottom 50% owning just 1%, the AI boom is functioning as a massive wealth transfer mechanism to those who already have the most. The numbers are stark:
- The wealthiest 1% hold $25.6 trillion in stocks[52]
- The bottom 50% hold $540 billion
- AI stocks accounted for 75% of market gains since ChatGPT's launch[53]
- The racial wealth gap is widening, with White families holding median stock values 2.8x higher than Hispanic families and 4.1x higher than Black families
This isn't just about numbers on a screen. The AI wealth gap affects retirement security, housing affordability, educational opportunity, healthcare access, and social cohesion. It's creating a bifurcated economy where experiences diverge dramatically based on stock ownership.
Historical comparisons to the dot-com bubble offer both comfort and concern. Today's AI leaders are more profitable and the technology more proven than in 2000. But market concentration is actually higher now, and we're starting from a position of already-extreme inequality.
Economists across the political spectrum agree that AI is widening the wealth gap, though they differ on solutions. Proposals range from higher capital gains taxes and wealth taxes to universal investment accounts and labor market interventions. Yet political gridlock has prevented major reforms, even as the problem worsens.
The future trajectory depends on choices we make now. Without intervention, projections suggest the top 1% could hold 35%+ of all wealth by 2050, while the bottom 50% falls below 2%. AI-driven job displacement could affect hundreds of millions of workers globally, further concentrating wealth among capital owners.
But alternative futures are possible. Policy interventions could broaden stock ownership, share productivity gains with workers, and ensure AI's benefits flow more equitably. The question is whether we have the political will to implement them.
As Mark Zandi warned, a widening wealth gap leads to political fracturing and makes consensus harder to achieve. We're already seeing this dynamic play out. The AI wealth gap is becoming a defining political issue, with implications for everything from tax policy to social stability.
The AI revolution is here, and it's transforming our economy in profound ways. The question isn't whether AI will continue to advance—it will. The question is whether its benefits will be broadly shared or narrowly concentrated. The answer will shape American society for generations to come.
The data is clear: the AI stock boom is making America more unequal. What remains unclear is whether we'll do anything about it.
References
[1] Yahoo Finance - Nvidia stock performance data (January 2024 - November 2025) [2] J.P. Morgan Asset Management - Magnificent Seven market capitalization analysis [3] Federal Reserve Survey of Consumer Finances Q2 2025 [4] Federal Reserve Economic Data (FRED) - Household wealth distribution [5] S&P 500 Index performance data 2024 [6] Federal Reserve - Distribution of household wealth by stock ownership [7] Edward Nathan Wolff, NYU Economics Department interview, CNBC 2025 [8] Pew Research Center - Stock ownership by income level 2025 [9] Gallup - Stock ownership demographics survey 2025 [10] Federal Reserve Survey of Consumer Finances 2022 - Median stock holdings by race [11] Federal Reserve data on generational wealth distribution Q2 2025 [12] Gallup polling data on stock ownership rates 2025 [13] Yahoo Finance historical stock prices (adjusted close) January 2024 - November 2025 [14] Nvidia contribution to S&P 500 returns - Bloomberg analysis 2024 [15] S&P Dow Jones Indices - Market capitalization concentration data [16] Michael Cembalest, J.P. Morgan Asset Management Market Insights 2025 [17] Magnificent Seven collective performance analysis - Goldman Sachs 2024 [18] Amazon Q3 2025 earnings call - CFO capex guidance [19] Microsoft, Alphabet, Meta earnings reports Q3 2025 - AI infrastructure spending [20] Federal Reserve - Distribution of Household Wealth Q2 2025 [21] Federal Reserve FRED database - Stock ownership by wealth percentile [22] Federal Reserve data on publicly traded stock wealth increases 2024-2025 [23] Edward Nathan Wolff interview, CNBC Economic Forum 2025 [24] U.S. Census Bureau - Income inequality trends 1979-2021 [25] Congressional Budget Office - Income distribution analysis 2021 [26] U.S. Census Bureau - Gini coefficient historical data [27] World Bank - International Gini coefficient comparisons [28] UBS Global Wealth Report 2025 [29] IRS Publication 550 - Investment Income and Expenses tax rates [30] Federal Reserve Survey of Consumer Finances - Wealth composition by race [31] Economic Policy Institute - Productivity-pay gap analysis 2024 [32] AFL-CIO Executive Paywatch 2021 - CEO compensation analysis [33] Federal Reserve data on retirement account ownership 2023 [34] Investment Company Institute - U.S. retirement market statistics 2024 [35] Vanguard - How America Saves 2024 report [36] Pew Research Center - Stock ownership by race 2025 [37] Federal Reserve Survey of Consumer Finances 2022 [38] Federal Reserve research on racial wealth gap determinants [39] Edward Nathan Wolff, NYU - Inequality research publications [40] Mark Zandi, Moody's Analytics - Economic outlook commentary 2025 [41] Joseph Stiglitz - "People Versus Robots" policy paper 2024 [42] McKinsey Global Institute - "Jobs Lost, Jobs Gained" report 2030 projections [43] Gabriel Zucman and Thomas Piketty - World Inequality Database research [44] White House Office of Management and Budget - FY2026 Budget Proposals [45] Economic Security Project - Universal investment account proposals [46] SECURE Act 2.0 provisions - Department of Labor implementation guide [47] Brookings Institution - AI and labor market policy recommendations [48] Grand View Research - Global AI Market Size Report 2024-2028 [49] World Inequality Database - Long-term inequality projections [50] McKinsey - Generative AI and racial wealth gap analysis 2025 [51] Nasdaq Composite historical data - Dot-com crash 2000-2002 [52] Federal Reserve Q2 2025 wealth distribution data [53] J.P. Morgan Asset Management - AI stock contribution analysis
This analysis is based on publicly available data and should not be considered investment advice. Market conditions and wealth distribution patterns are subject to change.
Word Count: 6,500+
Disclaimer: This analysis is for informational purposes only and does not constitute investment advice. Markets and competitive dynamics can change rapidly in the technology sector. Taggart is not a licensed financial advisor and does not claim to provide professional financial guidance. Readers should conduct their own research and consult with qualified financial professionals before making investment decisions.

Taggart Buie
Writer, Analyst, and Researcher